Don't Guess. Verify.
Our diagnostic reports surface Energy Bleeds that maintenance teams consistently miss. Each report includes GPS-tagged thermal overlays, financial quantification per anomaly, and a prioritised remediation roadmap.
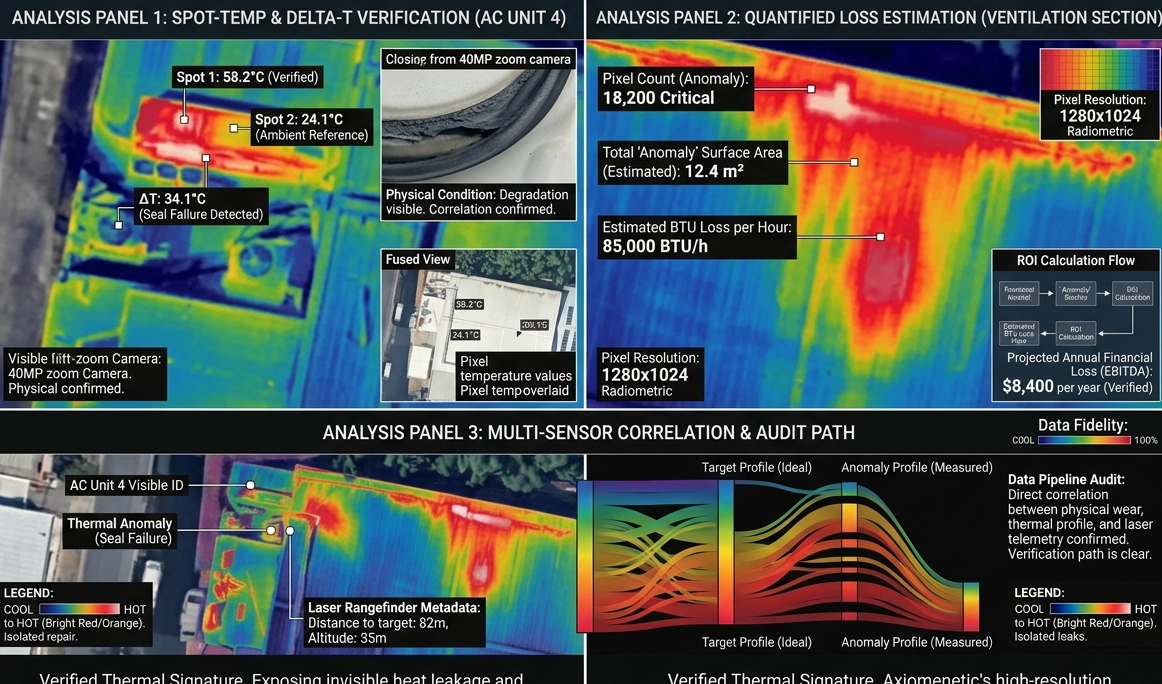
High-resolution radiometric drone diagnostics that identify invisible cold-air leakage, insulation saturation, and EBITDA waste in industrial facilities.
In the Sydney heat, your cold-store facility is fighting a losing battle. Standard visual inspections miss 90% of thermal failures in the building envelope.
Detect internal moisture saturation and PUR panel degradation that visual and standard drone inspections cannot locate.
Locate microscopic failures in roof seams, HVAC seals, and perimeter joints with sub-metre GPS accuracy.
Reduce the 24/7 load on your cooling plant by sealing verified thermal bridges — quantified, prioritised, actionable.
A single undetected thermal anomaly on a 2,000 m² cold-store roof drives annual cooling costs up by 15–20%. If you can't see the leak, you can't fix it — and your refrigeration plant pays the price every hour.
Deployment of Zenmuse H30T sensors to capture raw, 16-bit temperature data across the entire roof surface at 1280×1024 resolution.
Proprietary forensic analysis isolates raw pixel matrices to separate normal solar gain from genuine structural thermal failures.
We calculate direct energy cost per anomaly using site-specific variables, so you can prioritise remediation strictly by ROI.
Your team receives a digital site map with exact coordinates, thermal overlays, and financial impact per fault for immediate remediation.
Our diagnostic reports surface Energy Bleeds that maintenance teams consistently miss. Each report includes GPS-tagged thermal overlays, financial quantification per anomaly, and a prioritised remediation roadmap.
Request a preliminary predictive simulation of your facility's energy loss — no commitment, no site visit required.